Hystrix-dashboard 是一款针对Hystrix进行实时监控的工具,通过 Hystrix Dashboard 我们可以在直观地看到各Hystrix Command 的请求响应时间, 请求成功率等数据。但是只使用 Hystrix Dashboard 的话, 你只能看到单个应用内的服务信息。我们借助 Turbine ,能汇总系统内多个服务的数据并显示到 Hystrix Dashboard 上。
eureka 和 producer 搭建
首先我们需要创建 eureka 注册中心 以及 提供一个服务提供者 producer 。 eureka 负责服务的注册和发现,producer 负责对外提供服务。
创建 eureka 注册中心子项目
关于注册中心如何创建,大家参考之前的这两篇文章
创建 producer 服务提供者子项目
创建服务提供者,大家参考之前的这篇文章
创建服务消费者 consumer 子项目
该服务消费者通过 feign 发起对 服务提供者 producer 的远程调用,我们通过 Hystrix Dashboard 和 Turbine 主要就是对这个 consumer 的实时监控。来观察 Hystrix 的熔断与降级情况。
consumer pom.xml 依赖包管理
    <dependencies>

        <dependency>
            <groupId>org.springframework.cloud</groupId>
            <artifactId>spring-cloud-starter-netflix-eureka-client</artifactId>
        </dependency>

        <dependency>
            <groupId>org.springframework.boot</groupId>
            <artifactId>spring-boot-starter-web</artifactId>
        </dependency>

        <dependency>
            <groupId>org.springframework.boot</groupId>
            <artifactId>spring-boot-starter-actuator</artifactId>
        </dependency>

        <dependency>
            <groupId>com.imooc</groupId>
            <artifactId>feign-client-intf</artifactId>
            <version>${project.version}</version>
        </dependency>

        <dependency>
            <groupId>org.springframework.cloud</groupId>
            <artifactId>spring-cloud-starter-netflix-hystrix</artifactId>
        </dependency>
    </dependencies>
特别要强调的是feign-client-intf包依赖,如果有不清楚的,请参考我之前的这篇文章
consumer 配置文件
该服务消费者的配置文件中,我们把常用的都配置了一下,并添加了对应的注释,方便后续查看。
正式的生产环境,请大家根据自己的实际情况调整对应的配置。
spring.application.name=hystrix-consumer
server.port=50000
spring.main.allow-bean-definition-overriding=true
eureka.client.serviceUrl.defaultZone=http://localhost:20000/eureka/

# 开启Feign下面的Hystrix功能
feign.hystrix.enabled=true
# 是否开启服务降级
hystrix.command.default.fallback.enabled=true

# 全局超时
hystrix.command.default.execution.timeout.enabled=true
# 超时时间
hystrix.command.default.execution.isolation.thread.timeoutInMilliseconds=5000
# 超时以后终止线程
hystrix.command.default.execution.isolation.thread.interruptOnTimeout=true
# 取消的时候终止线程
hystrix.command.default.execution.isolation.thread.interruptOnFutureCancel=true
# hystrix.command.MyService#retry(int).execution.isolation.thread.timeoutInMilliseconds=3000


# 正儿八经的参数
# 熔断的前提条件(请求的数量),在一定的时间窗口内,请求达到5个以后,才开始进行熔断判断
hystrix.command.default.circuitBreaker.requestVolumeThreshold=5
# 超过50%的失败请求,则熔断开关开启
hystrix.command.default.circuitBreaker.errorThresholdPercentage=50
# 当熔断开启以后,经过多少秒再进入半开状态
hystrix.command.default.circuitBreaker.sleepWindowInMilliseconds=15000
# 配置时间窗口
hystrix.command.default.metrics.rollingStats.timeInMilliseconds=20000


# 打酱油的路人参数
hystrix.command.default.circuitBreaker.enabled=true
# 强制开启熔断开关
hystrix.command.default.circuitBreaker.forceOpen=false
# 强制关闭熔断开关
hystrix.command.default.circuitBreaker.forceClosed=false

# 以下feign-client相关的注释,为了方便自测试,做了特殊配置,生产环境一定要重新配置
# 每台机器最大重试次数
feign-client.ribbon.MaxAutoRetries=0
# 可以再重试几台机器
feign-client.ribbon.MaxAutoRetriesNextServer=0
# 连接超时
feign-client.ribbon.ConnectTimeout=1000
# 业务处理超时
feign-client.ribbon.ReadTimeout=8000
# 在所有HTTP Method进行重试
feign-client.ribbon.OkToRetryOnAllOperations=false


# actuator暴露接口
management.security.enabled=false
management.endpoints.web.exposure.include=*
management.endpoint.health.show-details=always
consumer 服务消费者启动类
@EnableDiscoveryClient
@SpringBootApplication
@EnableFeignClients
@EnableCircuitBreaker
public class HystrixFallbackApplication {

    public static void main(String[] args) throws NoSuchMethodException {
        new SpringApplicationBuilder(HystrixFallbackApplication.class)
                .web(WebApplicationType.SERVLET)
                .run(args);
    }

}
注意启动类上面的注解:
- EnableDiscoveryClient 启动服务发现,将自己注册到服务注册中心。
- SpringBootApplication spring boot 应用必须的注解
- EnableFeignClients 使能 feign
- EnableCircuitBreaker 使能熔断降级功能
定义 consumer 服务降级接口
IService 是服务提供者对外提供的服务接口,我们继承这个接口定义自己服务内部的降级服务接口,并添加FeignClient注释。
其中:
- name 为服务名称,一定要和服务提供者的名字保持一致。
- fallback 为本地实现的服务降级功能类。具体实现在后面
@FeignClient(name = "feign-client", fallback = Fallback.class)
public interface MyService extends IService {

}
定义 consumer 服务降级功能
实现我们定义的 MyService 接口,在每个的函数中,实现我们的自定义降级逻辑即可。 当某一个功能触发降级的时候,就会自动调用对应的函数,去做降级处理。
这个实现类,我们做了精简处理,大家可以自行扩展学习。
@Slf4j
@Component
public class Fallback implements MyService {

    @Override
    public String sayHi() {
        // 实现降级逻辑
        return "我们遇到错误了....";
    }

}
实现一个 consumer 服务消费者的控制器
控制器中 Autowired 引入 MyService,然后我们就可以和调用本地的一个服务一样,去发起远程调用了。
手动调用 sayHi 方法,适当调整我们的配置参数。当触发了我们配置的降级条件之后,就会自动走入我们的降级逻辑。
@RestController
public class Controller {

    @Autowired
    private MyService myService;

    @GetMapping("/sayHi")
    public String sayHi() {
        return myService.sayHi();
    }
}
启动该应用,手动调用 sayHi 方法,看看是否可以走到我们 Fallback 的对应函数中。
创建 Hystrix Dashboard 子项目
创建一个新的项目hystrix-dashboard。用来观察 上面创建的 consumer 项目情况。
Dashboard pom.xml 依赖包管理
    <dependencies>
        <dependency>
            <groupId>org.springframework.cloud</groupId>
            <artifactId>spring-cloud-starter-netflix-hystrix-dashboard</artifactId>
        </dependency>

        <dependency>
            <groupId>org.springframework.cloud</groupId>
            <artifactId>spring-cloud-starter-netflix-hystrix</artifactId>
        </dependency>

        <dependency>
            <groupId>org.springframework.boot</groupId>
            <artifactId>spring-boot-starter-actuator</artifactId>
        </dependency>
    </dependencies>
简单介绍下以下两个:
- actuator: 这个包是用来做服务监控的,很多监控相关的功能都会用到这个包。
- hystrix-dashboard: 这个是今天的主角,hystrix-dashboard帮我们封装好了hystrix的监控面板。
Dashboard 配置文件
spring.application.name=hystrix-dashboard
server.port=53000
启动类 HystrixDashboardApplication.java
@EnableHystrixDashboard
@SpringCloudApplication
public class HystrixDashboardApplication {

    public static void main(String[] args) throws NoSuchMethodException {
        new SpringApplicationBuilder(HystrixDashboardApplication.class)
                .web(WebApplicationType.SERVLET)
                .run(args);

    }
}
注意启动类上的两个注解 SpringCloudApplication 以及 SpringCloudApplication。一看就知道什么意思,这里不做过多解释了。
自测试 Hystrix Dashboard
Hystrix监控路径
consumer 服务的端口是50000,因此,Hystrix监控路径为:http://localhost:50000/actuator/hystrix.stream
浏览器打开该路径,可以看到有监控数据产生。

hystrix 监控特定服务
按照顺序启动服务,HystrixDashboard最后启动,启动完成后我们访问:http://localhost:53000/hystrix,将会看到如下界面:
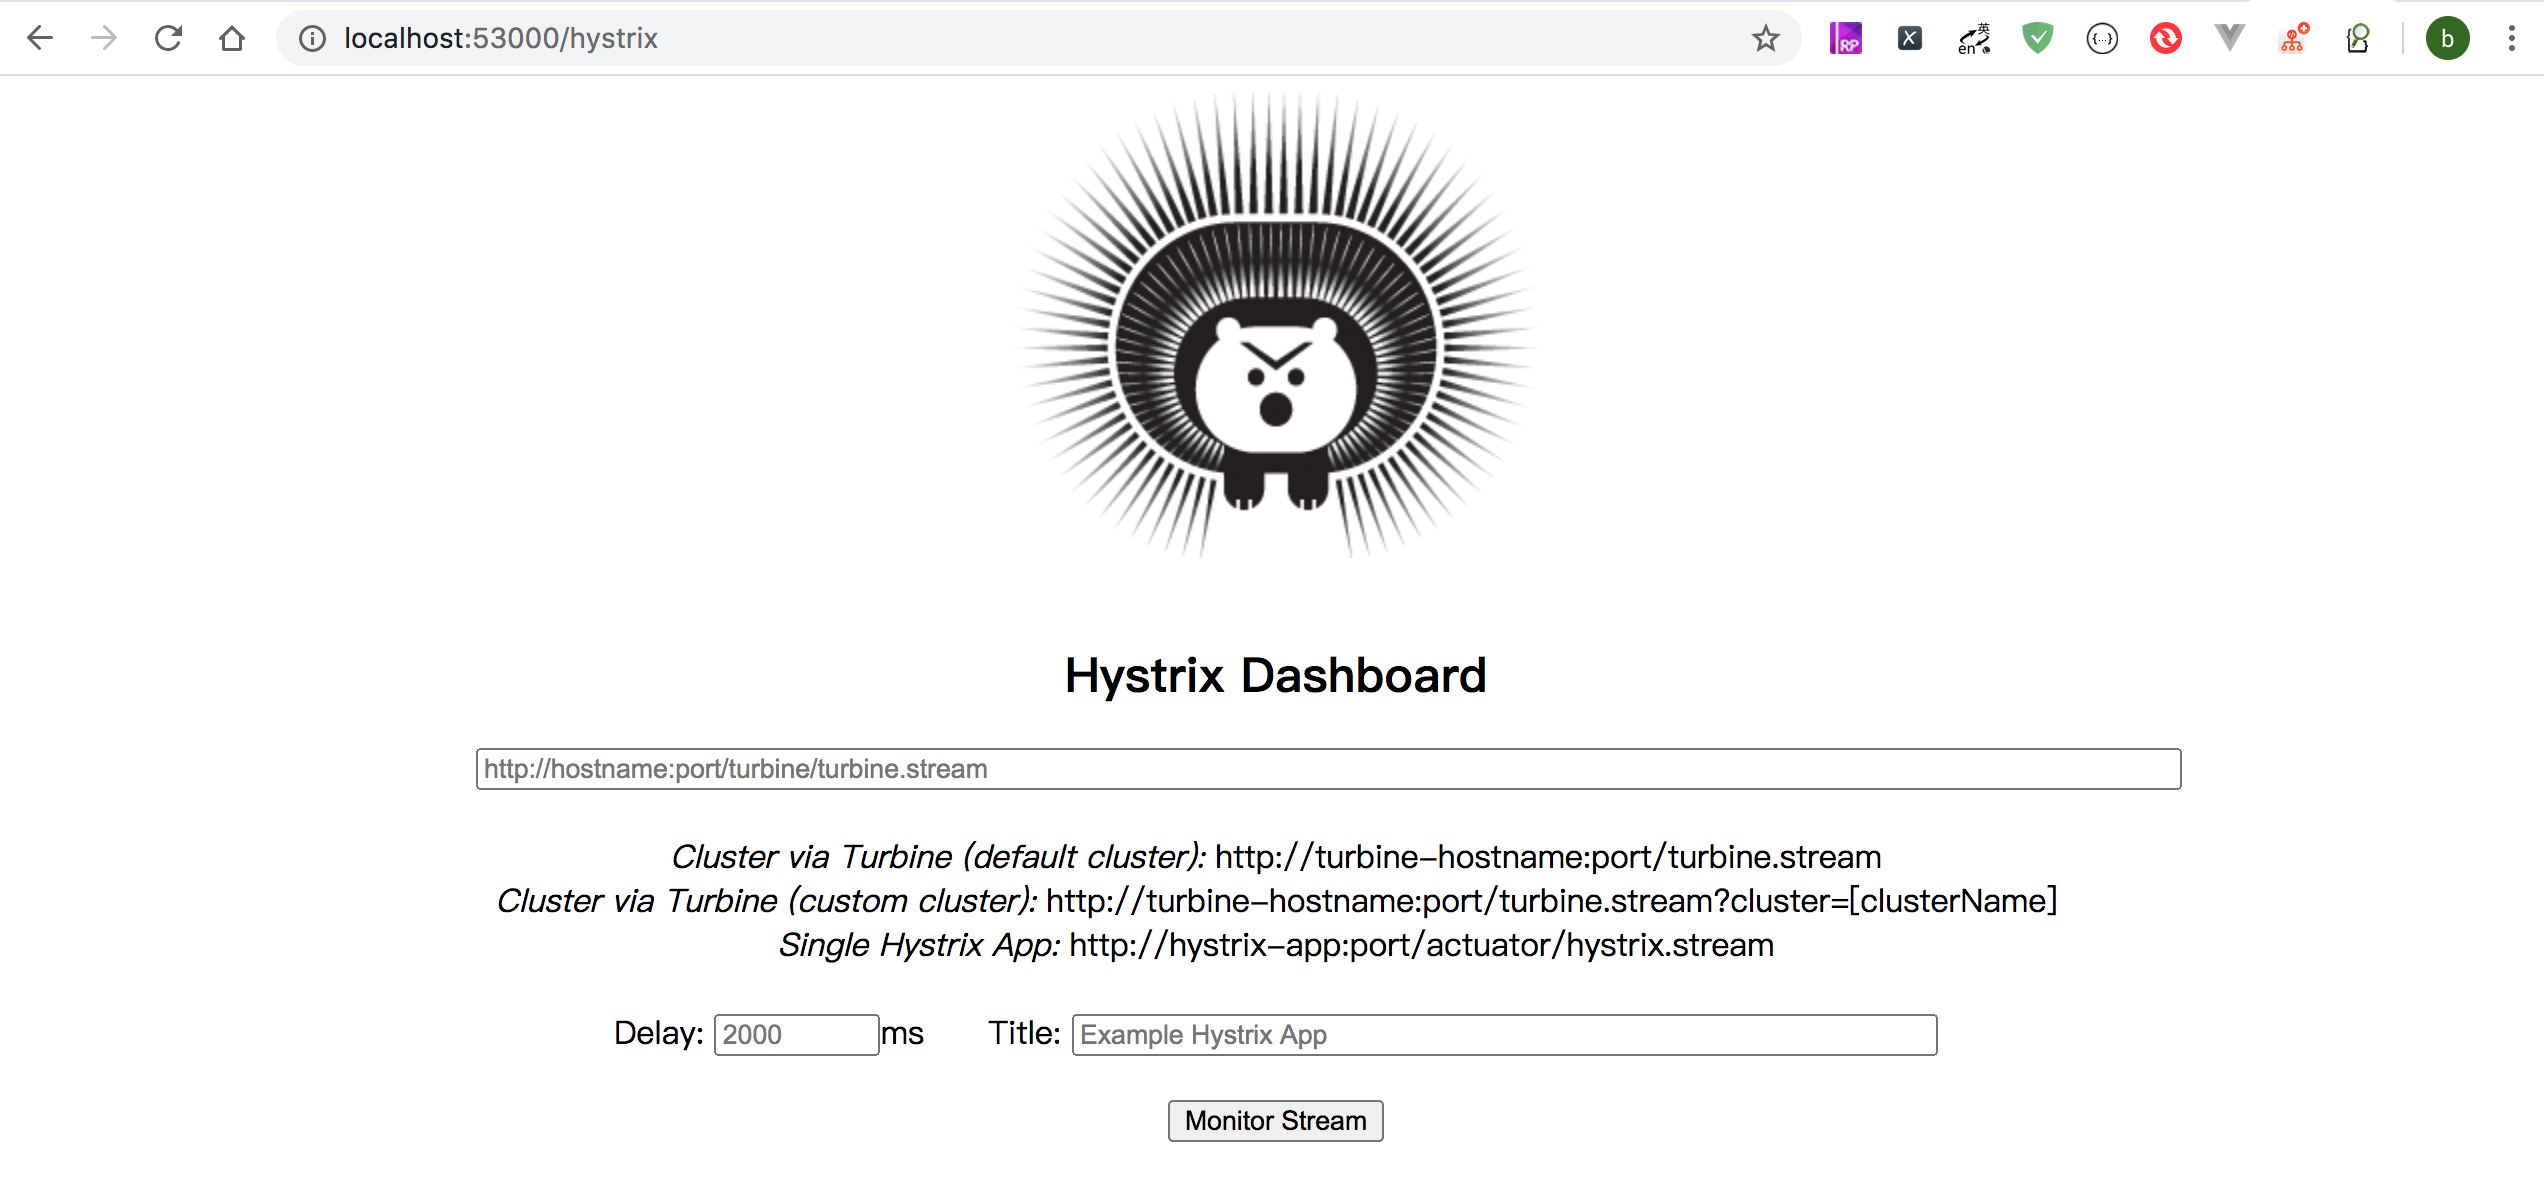
图中会有一些提示:
Cluster via Turbine (default cluster): http://turbine-hostname:port/turbine.stream
Cluster via Turbine (custom cluster): http://turbine-hostname:port/turbine.stream?cluster=[clusterName]
Single Hystrix App: http://hystrix-app:port/actuator/hystrix.stream
大致大概意思就是如果查看默认集群使用第一个url,查看指定集群使用第二个url,单个应用的监控使用最后一个,我们暂时只演示单个应用的所以在输入框中输入: http://localhost:53000/hystrix.stream ,输入之后点击 monitor,进入页面。

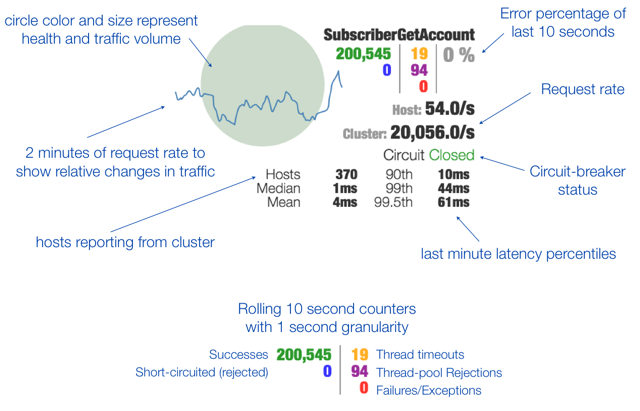
其实就是 http://localhost:53000/hystrix.stream 返回结果的图形化显示,Hystrix Dashboard Wiki 上详细说明了图上每个指标的含义,如下图:
Turbine 子项目创建
在复杂的分布式系统中,相同服务的节点经常需要部署上百甚至上千个,很多时候,运维人员希望能够把相同服务的节点状态以一个整体集群的形式展现出来,这样可以更好的把握整个系统的状态。 为此,Netflix 提供了一个开源项目(Turbine)来提供把多个 hystrix.stream 的内容聚合为一个数据源供 Dashboard 展示。
Turbine 子项目 pom.xml
    <dependencies>
        <dependency>
            <groupId>org.springframework.cloud</groupId>
            <artifactId>spring-cloud-starter-netflix-eureka-client</artifactId>
        </dependency>

        <dependency>
            <groupId>org.springframework.boot</groupId>
            <artifactId>spring-boot-starter-web</artifactId>
        </dependency>

        <dependency>
            <groupId>org.springframework.boot</groupId>
            <artifactId>spring-boot-starter-actuator</artifactId>
        </dependency>

        <dependency>
            <groupId>org.springframework.cloud</groupId>
            <artifactId>spring-cloud-starter-netflix-hystrix</artifactId>
        </dependency>

        <dependency>
            <groupId>org.springframework.cloud</groupId>
            <artifactId>spring-cloud-starter-netflix-turbine</artifactId>
        </dependency>
    </dependencies>
Turbine 子项目配置文件
配置文件中添加turbine 相关的配置
spring.application.name=hystrix-turbine
server.port=52000
management.port=52001


eureka.client.serviceUrl.defaultZone=http://localhost:20000/eureka/

# 指定了所需要监控的服务名
turbine.app-config=hystrix-consumer
turbine.cluster-name-expression="default"
# 将端口和hostname作为区分不同服务的条件(默认只使用Host)
turbine.combine-host-port=true
turbine.instanceUrlSuffix.default=actuator/hystrix.stream
turbine.aggregator.clusterConfig=default
注意:
- turbine.appConfig: 配置Eureka中的serviceId列表,表明监控哪些服务
- turbine.aggregator.clusterConfig: 指定聚合哪些集群,多个使用”,”分割,默认为default。可使用http://…/turbine.stream?cluster={clusterConfig之一}访问
- turbine.clusterNameExpression:
- clusterNameExpression指定集群名称,默认表达式appName;此时:turbine.aggregator.- clusterConfig需要配置想要监控的应用名称;
- 当clusterNameExpression: default时,turbine.aggregator.clusterConfig可以不写,因为默认就是default;
- 当clusterNameExpression: metadata[‘cluster’]时,假设想要监控的应用配置了eureka.instance.metadata-map.cluster: ABC,则需要配置,同时turbine.aggregator.clusterConfig: ABC
Turbine 子项目启动类
@EnableDiscoveryClient
@EnableHystrix
@EnableCircuitBreaker
@EnableTurbine
@EnableAutoConfiguration
public class TurbineApplication {

    public static void main(String[] args) throws NoSuchMethodException {
        new SpringApplicationBuilder(TurbineApplication.class)
                .web(WebApplicationType.SERVLET)
                .run(args);

    }
}
注意启动类上的注解,尤其是第一次看到的 EnableTurbine,它的作用就是使能 Turbine 对 hystrix.stream 的内容聚合功能。
联调
现在依次启动注册中心 eureka,provider,consumer,Turbine 以及 Dashboard 子项目,访问消费者 consumer 子项目对应的controller 中的方法,然后访问turbine.stream路径: http://localhost:52000/turbine.stream
我们会发现,返回的数据和上面直接使用 Dashboard 时是一样的。该页面随着用户的请求,不断刷新,显示实时的监控数据。至此,说明和单个的监控类似,成功返回了监控聚合项目的信息。

总结
通过本文,我们介绍了如何通过 Hystrix Dashboard 监测单独服务的 Hystrix Command 请求响应时间, 请求成功率等数据。
然后我们又在在 Hystrix stream 的基础上通过设置 Turbine 以获得聚合数据与视图。
文档信息
- 本文作者:Piter Jia
- 本文链接:https://piterjia.github.io/2020/06/11/hystrix-dashboard-turbine/
- 版权声明:自由转载-非商用-非衍生-保持署名(创意共享3.0许可证)